User Guide
Getting Started
First Login
When you launch ezSWM for the first time, a setup wizard guides you through two steps:
- Admin account — pick a username, display name and password.
- First site — give your first site a name (e.g.
HQ,Datacenter,LAN-Party). Sites group switches, VLANs and subnets; you can rename it later and add more.
If you're upgrading from a version that did not yet have sites, the wizard skips step 1 and asks only for the site name. Any existing switches, VLANs and subnets are automatically reassigned to the site you create.
After setup, you are redirected to the login screen.
Dashboard Overview
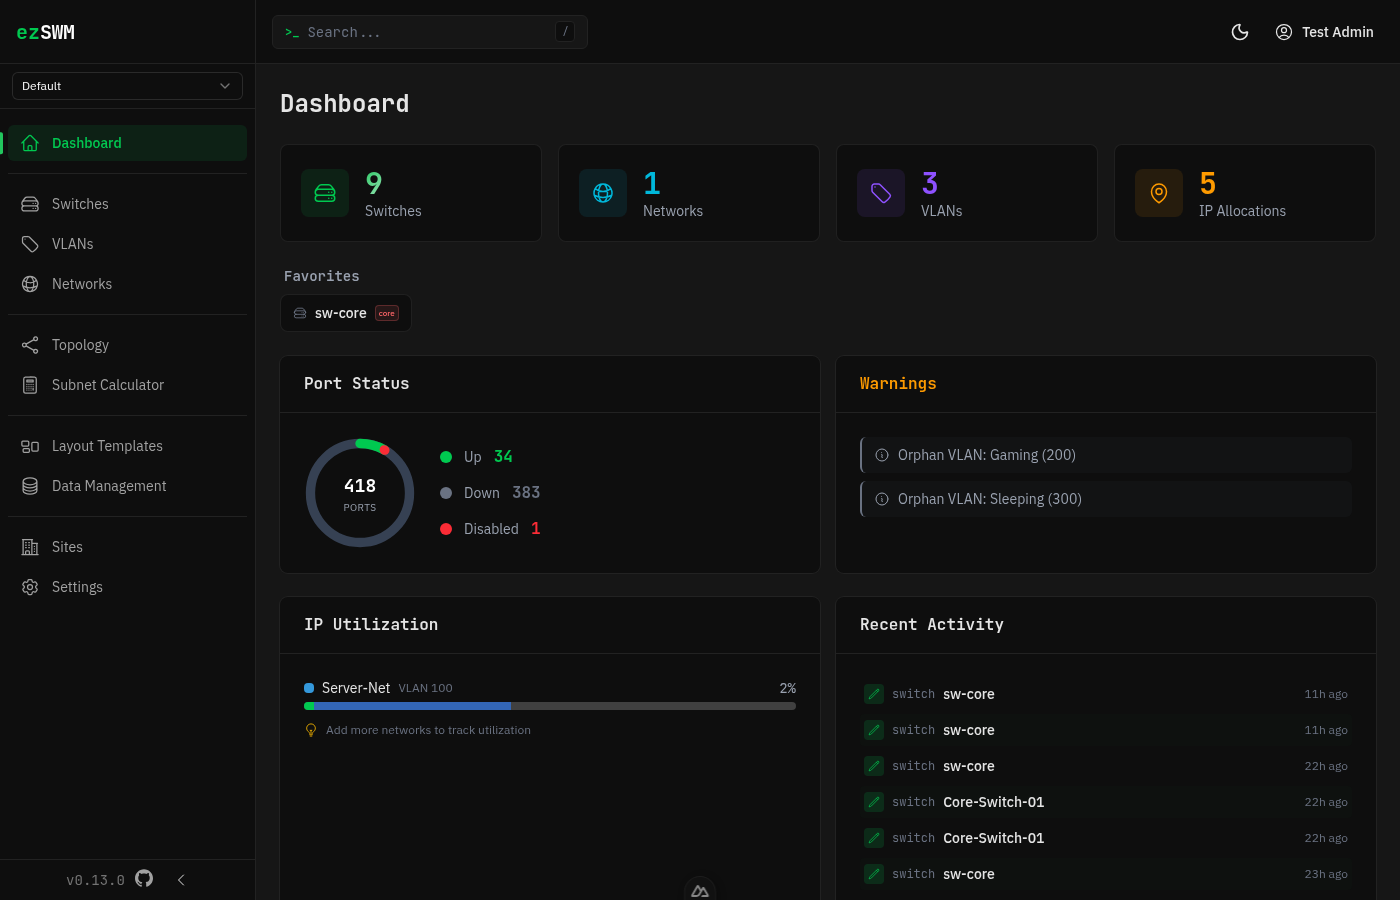
After logging in, the dashboard provides a summary of your infrastructure: total switches, VLANs, subnets, and IP utilization. The sidebar on the left gives access to all sections. The header bar contains global search, a theme toggle (dark/light), language selector, and user menu.
Unsaved Changes Protection
When you have unsaved changes in a create or edit form, ezSWM warns you before navigating away — whether you click another link inside the app or try to close the browser tab. The same protection applies consistently to every editing side panel (switch and port editing, bulk port edits, LAG groups, IP allocations and ranges, networks, VLANs, sites): closing a panel with unsaved changes — by clicking outside it, pressing Escape, or hitting Cancel — prompts you first. Save or explicitly confirm "leave" to discard the changes.
Switching Language
Use the language selector in the header bar (top-right, globe icon) to switch between English and German at any time. Your choice is saved to your profile, so it persists across reloads and devices. You can also change it under Settings → Account.
Layout Templates
What They Are
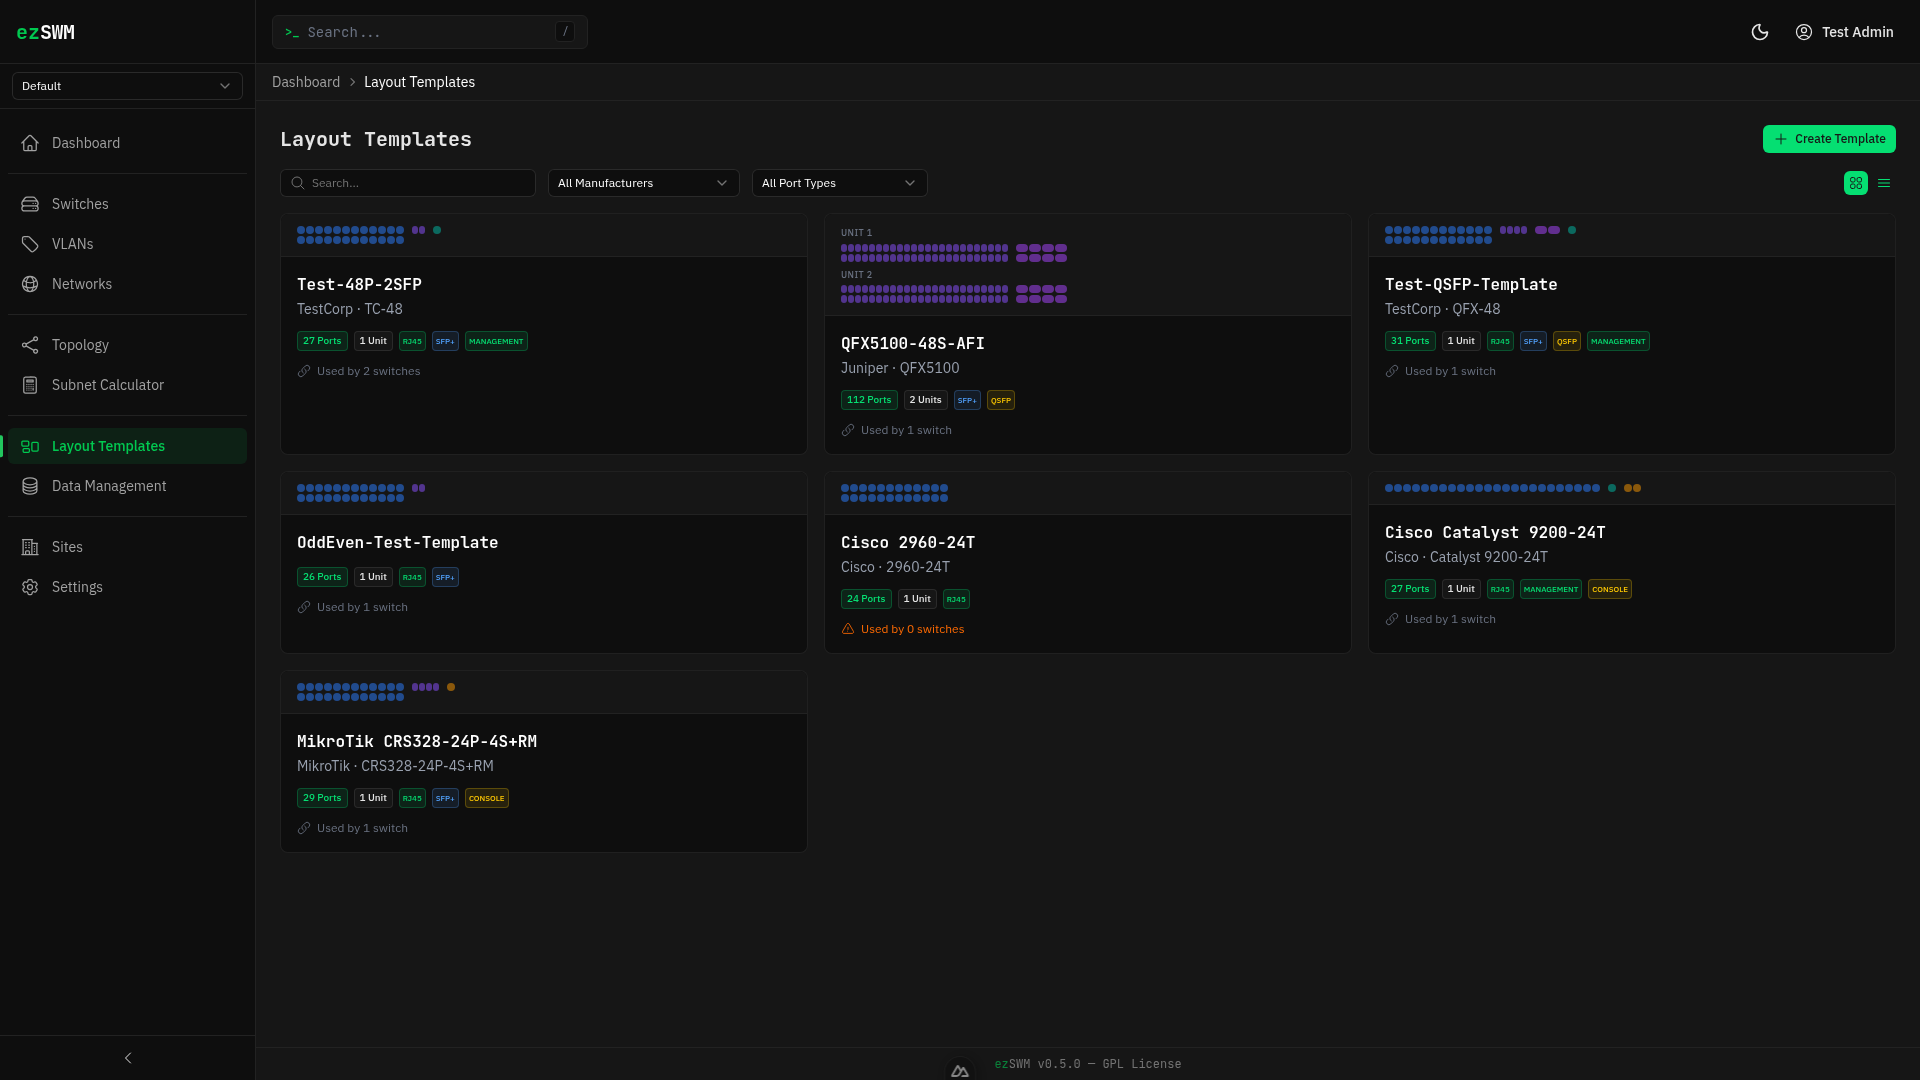
Layout templates define reusable switch model definitions. Instead of manually configuring port layouts for every switch, you create a template once (e.g., "Cisco C9300-48P") and assign it to any number of switches. The template determines how many ports appear, their types, and how they are visually arranged.
How to Create One
Navigate to Layout Templates in the sidebar and click Create Template. A dialog offers two options:
- Manual -- build a template from scratch
- Import from Library -- import from the NetBox Device Type Library (5,000+ devices from 270+ manufacturers)
Import from Library
Search for any device by manufacturer or model name (e.g., "Cisco 9200" or "MikroTik CRS328"). Select a device to see a port grid preview. Click Import to populate the create form with the device's port layout, which you can adjust before saving.
The import automatically:
- Maps NetBox interface types to ezSWM port types (RJ45, SFP, SFP+, QSFP, Console, Management)
- Detects PoE capabilities and sets them on port blocks
- Deduplicates combo ports (e.g., Juniper ge/xe on the same physical slot)
- Filters out non-physical interfaces (WiFi, stacking, virtual)
- Extracts datasheet URLs and airflow direction from device metadata
If some interfaces are not supported, a warning banner shows which types were skipped.
TIP
The library is fetched on-demand from GitHub. An internet connection is required. If unavailable, an error message is shown.
Manual Creation
Basic fields:
- Name (required) -- a descriptive name, e.g., "UniFi USW-48-PoE"
- Manufacturer -- e.g., "Ubiquiti"
- Model -- e.g., "USW-48-PoE"
- Description -- optional notes
- Datasheet URL -- link to the manufacturer's datasheet (optional)
- Airflow -- cooling direction: Front to Rear, Rear to Front, Passive, etc. (optional)
Units:
A template has one or more units (rack units). Each unit contains one or more port blocks. Click Add Unit to add additional units for stackable or multi-unit switches.
Port blocks:
Each block defines a group of ports within a unit:
- Blocks can be reordered within the unit by dragging the handle or using the up/down buttons.
- Type -- RJ45, SFP, SFP+, QSFP, Console, or Management
- Count -- number of ports in this block
- Start Index -- the first port number (default 1)
- Rows -- how many rows to render (1 for single-row, 2 for dual-row like most 48-port switches)
- Row Layout -- how ports are distributed across rows:
- Sequential -- fills top row first, then bottom row
- Odd/Even -- odd-numbered ports on top, even on bottom
- Even/Odd -- even-numbered ports on top, odd on bottom
- Default Speed -- 100M, 1G, 2.5G, 10G, or 100G
- Label -- optional prefix for port labels
- PoE -- Power over Ethernet type: 802.3af (15W), 802.3at (30W), 802.3bt Type 3 (60W), 802.3bt Type 4 (100W), Passive 24V, or Passive 48V. Ports generated from this block inherit the PoE setting. PoE ports are marked with a yellow "PoE" label in the port grid.
- Physical Type -- (Management ports only) RJ45 or SFP, to indicate the physical connector type
Smart Labels
If the block label ends with a separator character (/, -, :, or .), the port index is appended directly. For example, a label of Gi1/0/ produces ports Gi1/0/1, Gi1/0/2, etc. Without a trailing separator, the label is combined with the unit and port index like Label 1/1.
Live Preview
As you configure units and blocks, a live port grid preview renders at the bottom of the form so you can verify the layout before saving.
Switches
Creating a Switch
Navigate to Switches in the sidebar and click Create.
Fields:
Name (required) -- e.g., "Core-SW-01"
Model -- hardware model
Manufacturer -- hardware vendor
Serial Number -- for inventory tracking
Location -- physical location, e.g., "Server Room A, Rack 3"
Rack Position -- position within the rack
Management IP -- must be a valid IPv4 address
Firmware Version -- currently running firmware
Layout Template -- select a previously created template; this generates the port grid. If no template fits, click Create New next to the dropdown to open a quick-create modal. The modal has two tabs:
- Manual -- fill in name, port count, and port type.
- Import from Library -- search the NetBox Device Type Library by manufacturer or model name, preview the port layout, and click Import to create the template automatically. Manufacturer and model are pulled from the device definition.
In both cases the new template is added to the list and pre-selected. When a template with manufacturer/model data is selected, those fields in the switch form are auto-filled (editable, and locking once manually overridden). Use Open full editor for advanced templates with multiple units, blocks, or PoE settings.
Stack Size -- number of stacking members (1-8). Only visible when a template is selected. When set to more than 1, the template's ports are duplicated for each stack member with automatically incremented port labels (e.g., GigabitEthernet1/0/1 for member 1, GigabitEthernet2/0/1 for member 2). The port grid shows a visual divider between stack members.
Role -- Core, Distribution, Access, or Management
Tags -- freeform tags; type and press Enter to add, click a tag to remove
Notes -- freetext
Port Visualization
On a switch detail page, ports are rendered as a visual grid matching the layout template. Ports are color-coded by their assigned VLAN. Trunk ports (carrying multiple VLANs) display a circle indicator with ring. Access ports show a square indicator. Unassigned ports appear in a neutral color.
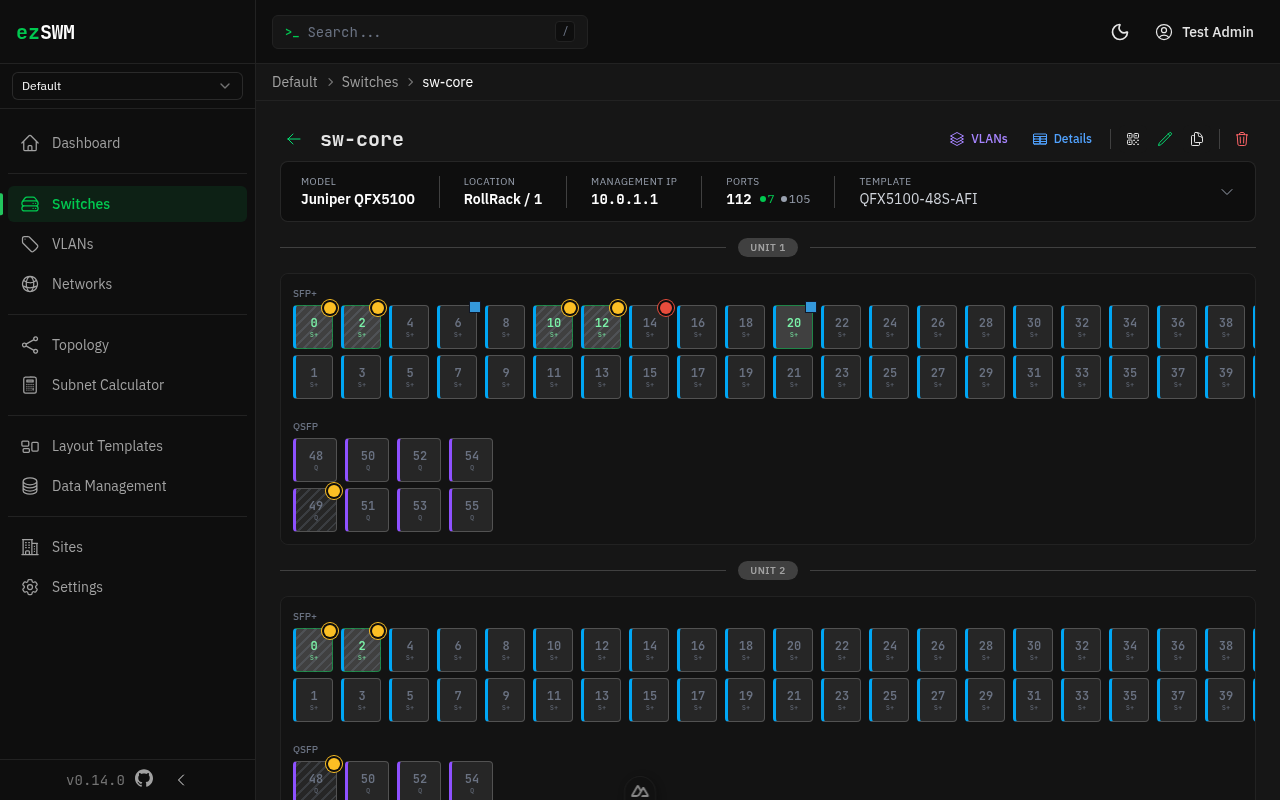
Below the port grid, a legend summarizes all visual indicators: port status (up/down/disabled), port types (SFP/QSFP/Console/Mgmt), port mode (access/trunk), active VLANs with their colors, and LAG groups. A multi-select hint reminds you how to select multiple ports (Ctrl/Cmd + Click). The hint automatically hides when ports are selected.
The info bar above the port grid shows key switch details (model, location, management IP, port count, template). Click the bar to expand the full detail panel with all switch fields inline.
The top-right action bar provides quick access to:
- VLANs — opens a slideover to manage which VLANs are configured on this switch (add/remove)
- Details — opens a slideover with two tabs:
- Ports — a tabular view of all ports with status summary
- Activity — recent changes to this switch
Editing Ports
Click any port in the grid to open a slideover panel. From there you can configure:
- Native VLAN -- the untagged VLAN for this port
- Tagged VLANs -- additional VLANs carried on a trunk
- Speed -- override the default speed
- Status -- up, down, or disabled
- Connected Device -- what is plugged into this port (see below)
- PoE -- override or disable PoE for this specific port (inherited from the template block by default)
- Description -- port-level notes
Bulk Port Editing
Select multiple ports by holding Ctrl (or Cmd on Mac) and clicking, then use the bulk edit action to apply the same VLAN, speed, or status to all selected ports at once.
Connected Device Linking
Each port can track what is connected to it. Two modes are available:
- Freetext -- type a device name manually (e.g., "AP-Floor2-West")
- Switch Reference -- link to another switch and port in ezSWM; this creates a bidirectional connection that stays in sync when either end is updated
Resetting a port (single or bulk) clears its settings and removes the connection on both ends. The linked port keeps its own configuration -- only the link is removed.
Confirmations (resetting ports, overwriting LAG connections, leaving a page with unsaved changes) use in-app dialogs rather than native browser popups.
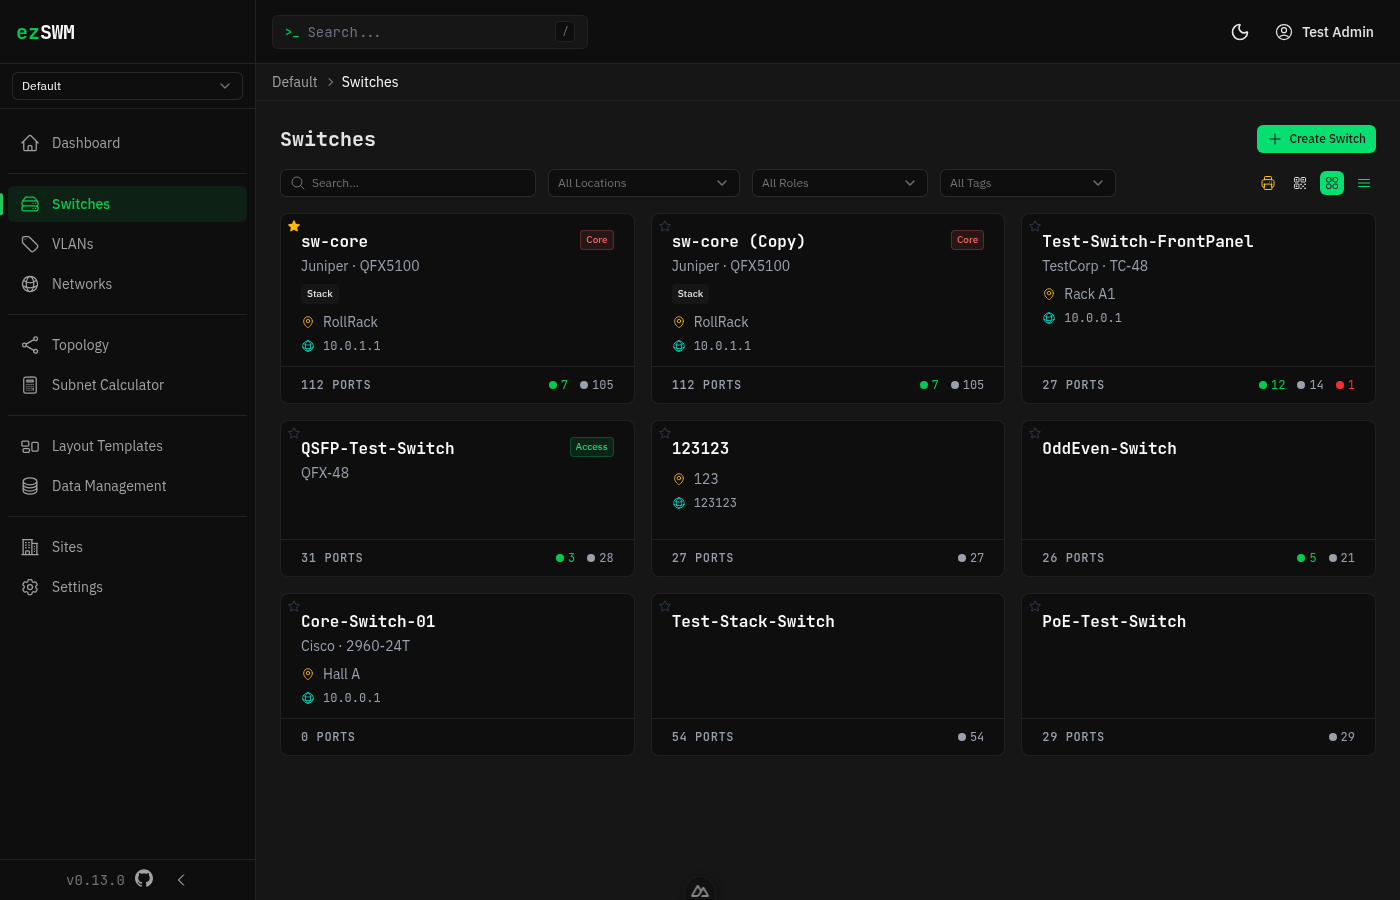
Filtering Switches
The switch list toolbar provides three filter dropdowns (location, role, tags). Each dropdown shows only values present in the currently visible switches (site-scoped when viewing a specific site, global when viewing All Sites). Select All … at the top of any dropdown to clear that filter. Each dropdown displays a leading icon for quick visual identification.
Drag & Drop Sort Order
On the switch list page, you can drag switches to reorder them. The sort order is persisted and reflected across all views.
Favorite Switches
Click the heart icon on any switch card to mark it as a favorite. Favorite switches appear at the top of the list with a filled heart icon, making them easy to find. Favorites are stored per user and persist across sessions.
Printing Switches
You can print switch port grids for labeling or documentation purposes.
Single switch: Hover over a switch card in the list and click the printer icon (amber).
Multiple switches: Click the printer icon in the toolbar to open the print picker. Select switches via checkboxes (grouped by site when viewing all sites), then click "Print selected". When filters are active, only filtered switches appear in the picker.
The print page opens in a new tab showing each switch with its port grid on a white background. Access ports are tinted with their VLAN color. Trunk ports are marked with a black dot. A compact VLAN legend below each switch shows which VLANs are in use.
Click Print to open the browser's print dialog, or use Ctrl+P. The output is formatted for A4 landscape with each switch on its own page.
Public QR Access
Generate a QR code for any switch that links to a public, read-only mobile view — no login required. Ideal for LAN parties or events where non-technical helpers need to see the port layout.
Generating a QR code: Open a switch detail page and click the QR code icon in the top-right action bar. A drawer opens where you can:
- Generate Public Link — creates a unique 32-character token
- Copy Link — copies the public URL to clipboard
- Download SVG / PNG — downloads the QR code as an image file
- Print Sticker — opens a print-optimized sticker page
- Revoke Token — invalidates the QR code immediately
Bulk QR printing: In the Switches overview, click the QR code icon in the toolbar. Select switches via checkboxes, then click "Print Sticker". Tokens are automatically created for switches that don't have one yet. The print page shows a 3-column sticker grid with QR code, switch name, model, and location.
Public mobile view: When someone scans the QR code, they see a mobile-friendly page showing:
- Switch name, model, and location
- All ports with their VLAN assignment and purpose
- Filter chips to show only specific VLANs (e.g. Gaming, Server, Sleeping)
- Clear "Tech only — do not use" warnings for infrastructure ports
- On desktop: the full port grid visualization is also shown
The public view does not require login, does not show sensitive data (no management IPs, serial numbers, or internal IDs), and is marked with noindex to prevent search engine indexing.
Helper Usage (Port Classification): Each port can be explicitly classified for the public helper view. Open a port's side panel and scroll to the "Public Helper View" section:
- Helper view role — choose from Automatic, Participant, Phone + PC, Access Point, Printer, Orga, or Uplink (Tech only)
- Custom label — override the default role label (e.g. "VIP Area" instead of "Orga")
- Show in helper port list — uncheck to hide the port from the helper port list (it still appears in the desktop grid)
If set to "Automatic", the port is classified using the legacy inference: uplinks → Tech only, trunk ports → Special device, access ports → Participant.
You can also set the helper usage role in bulk via the bulk editor.
LAG Groups (Link Aggregation)
What They Are
LAG (Link Aggregation Group) combines multiple physical ports into a single logical link for increased bandwidth and redundancy. In LACP (Link Aggregation Control Protocol) setups, both sides of a link must be configured with matching LAG groups.
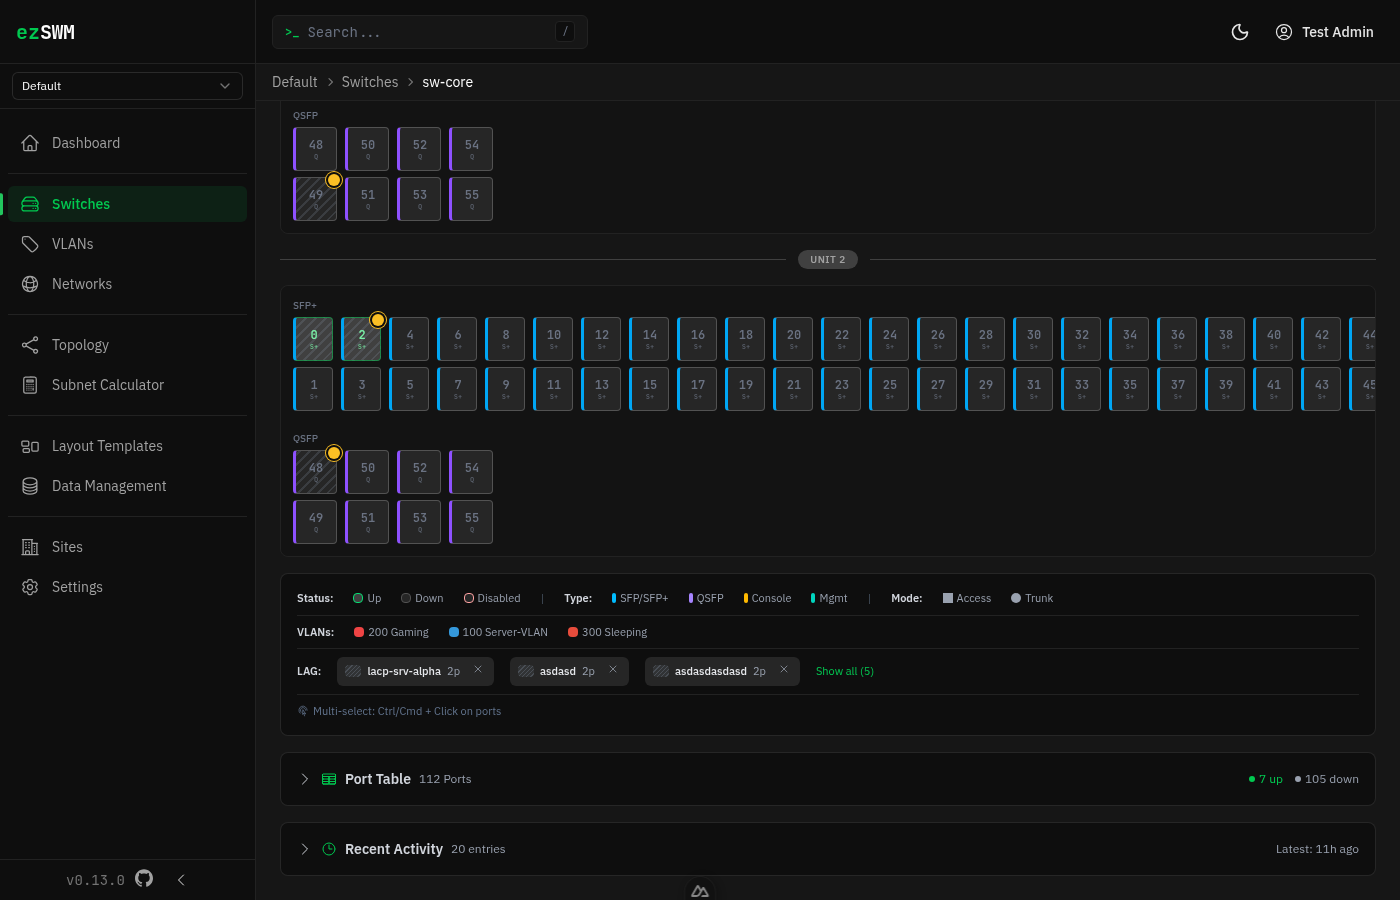
LAG ports are visually identified by a diagonal stripe pattern overlay. Hovering over a LAG port shows a tooltip with the LAG name, port count, and remote device.
Creating a LAG
- Navigate to a switch detail page
- Ctrl+Click two or more ports to multi-select them
- Click the Create LAG button in the selection bar
- Fill in the LAG details:
- Name (required) -- e.g., "Uplink-Core"
- Description -- optional notes
- Remote Device -- choose connection mode:
- None -- no remote device
- Switch -- select another switch from the database; enables port mapping
- Freetext -- type a device name manually
- Port Mapping -- when a remote device is set, map each local port to its corresponding remote port
- Click Create
When creating a LAG with a remote switch, a mirror LAG is automatically created on the remote switch with the reverse port mapping.
TIP
The create button is disabled with an inline hint if fewer than 2 ports are selected or if any selected port is already in another LAG.
Port Mapping
When configuring a LAG with a remote switch, the slideover shows a mapping table:
| Local Port | Remote Port | |
|---|---|---|
| Gi1/0/1 | → | Dropdown of remote ports |
| Gi1/0/2 | → | Dropdown of remote ports |
For freetext remote devices, text inputs replace the dropdowns.
Conflict detection:
- Remote ports already in another LAG on the remote switch are blocked (red warning)
- Remote ports with existing connections show an amber warning with the current connection; you can still save after confirmation
Editing a LAG
Click a LAG chip in the legend below the port grid to open the edit slideover. Changes to ports, remote device, or port mapping are applied to both the local and mirror LAG on save.
Deleting a LAG
Click the X button on a LAG chip in the legend. The confirmation dialog shows:
- Which local ports will be released
- Whether a mirror LAG on the remote switch will also be deleted
LAG Legend
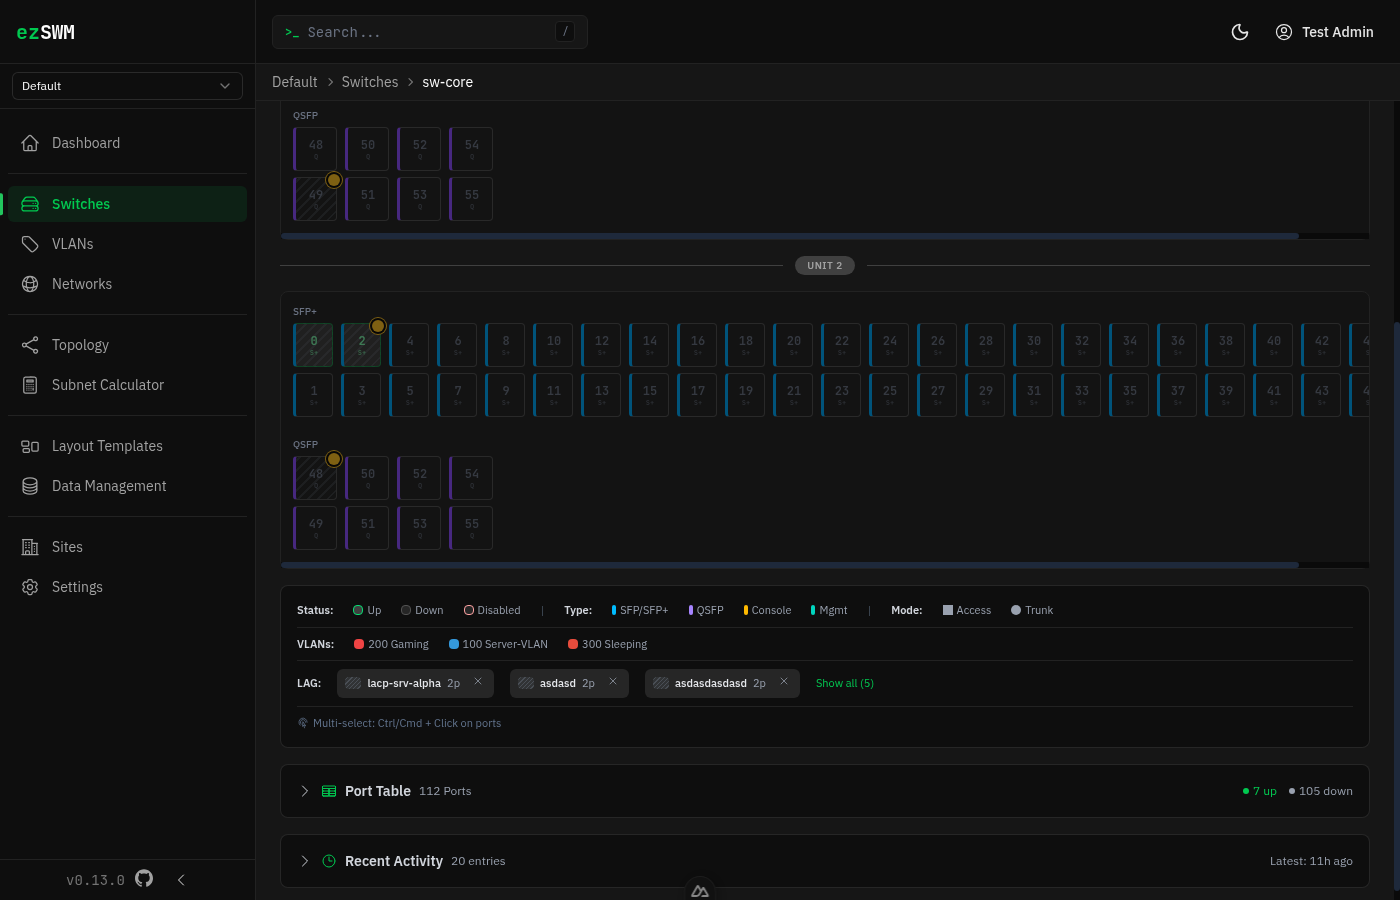
The LAG legend is part of the legend card below the port grid. Each LAG group is shown as an interactive chip with the LAG name, port count, and remote device.
- Hover a LAG chip to highlight its member ports (non-members dim)
- Click a chip to edit the LAG
- X button to delete the LAG
- When more than 3 LAGs exist, a Show all (N) toggle expands the full list
LAG Port Sync
When editing a port that belongs to a LAG, the following settings are automatically synchronized to all other LAG member ports:
| Synced | Individual |
|---|---|
| VLAN config (native, tagged, access, port mode) | Description |
| Speed | MAC address |
| Status | Connected port (different physical port on same device) |
| Connected device |
LAG in Port Side Panel
When viewing a LAG port in the side panel, a LAG Group field shows the LAG name and a Remove from LAG button. If removing the port would leave fewer than 2 members, the entire LAG is deleted.
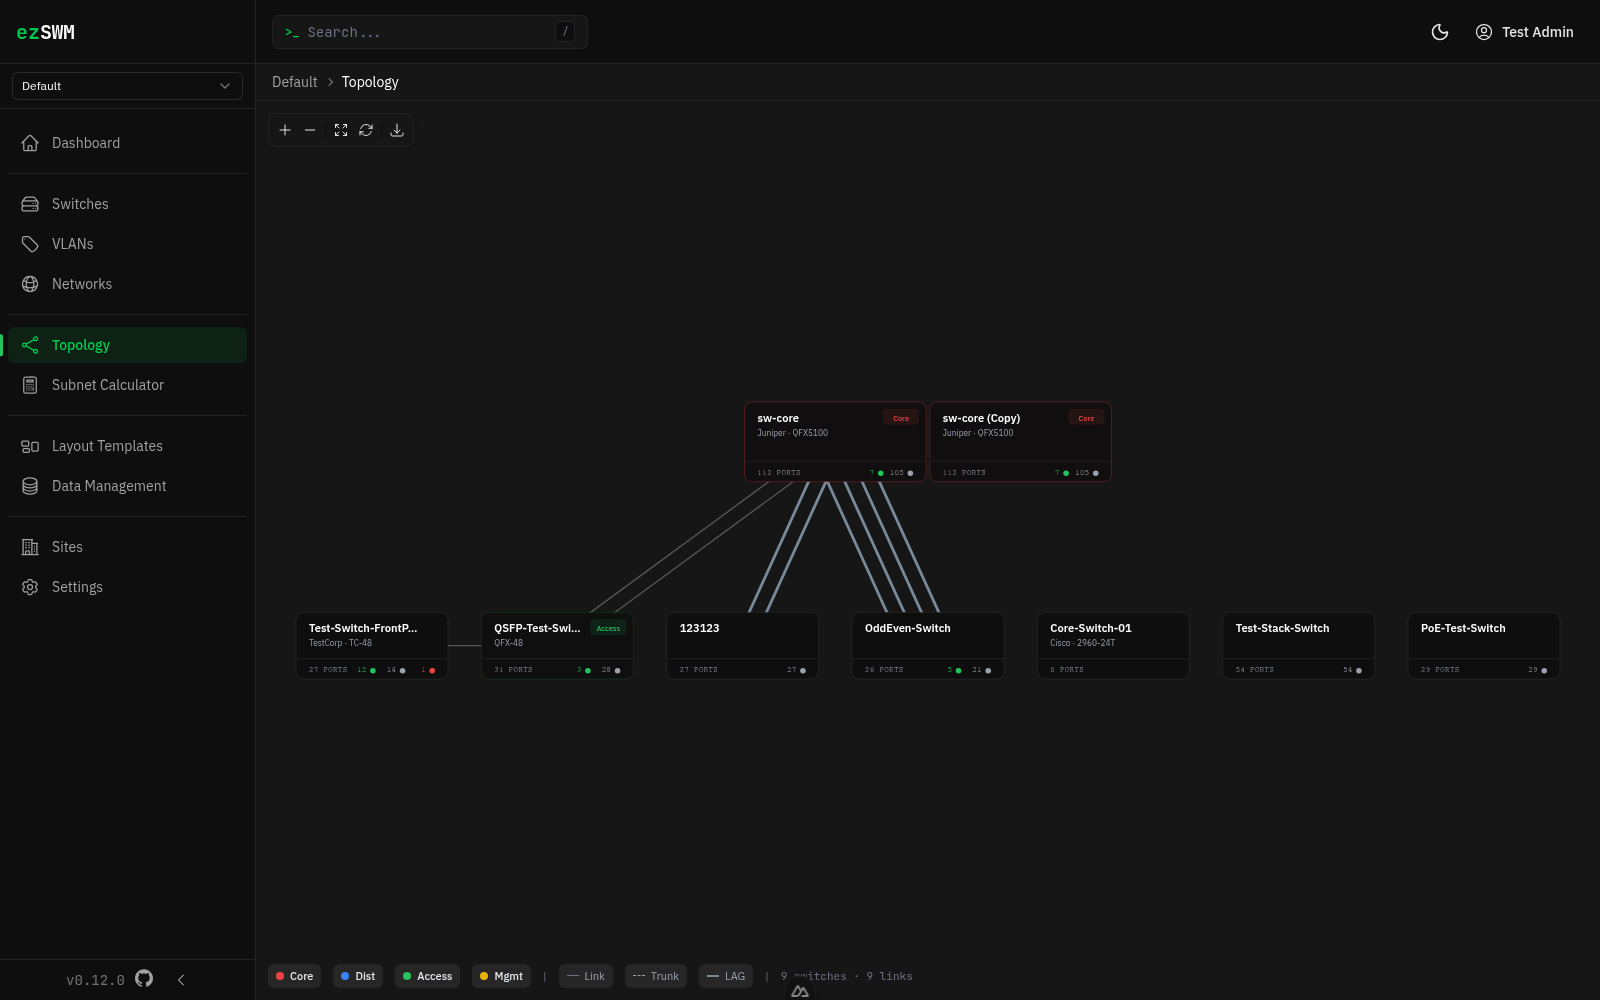
Network Topology
Overview
The topology page provides an interactive, site-scoped graph visualization of your switch-to-switch connections. It shows how switches are connected via port links and helps you understand the physical network structure at a glance.
Navigate to Topology in the sidebar (only visible when a specific site is selected — not in the "All Sites" view).
Graph Layout
Switches are arranged in a hierarchical layout based on their role:
- Core switches appear at the top (largest cards)
- Distribution switches in the middle
- Access and other switches at the bottom
The graph automatically fits to the available canvas on page load. You can pan by dragging the canvas, zoom with the scroll wheel, and drag individual nodes to reposition them. Repositioned nodes are saved and restored on next visit.
Edge Types
Connections between switches are visually differentiated:
| Type | Appearance | Description |
|---|---|---|
| Link | Thin solid line | Single port connection |
| Trunk | Dashed line | Connection carrying multiple VLANs |
| LAG | Thick solid line (blue-gray) | Link Aggregation Group |
The legend at the bottom of the canvas explains all visual indicators.
Detail Panel
Click any switch node to open the detail panel. It shows:
- Switch name, role, manufacturer, and model
- Location and management IP
- Port statistics (up / down / disabled)
- All connections grouped by target switch, with port mappings and VLANs
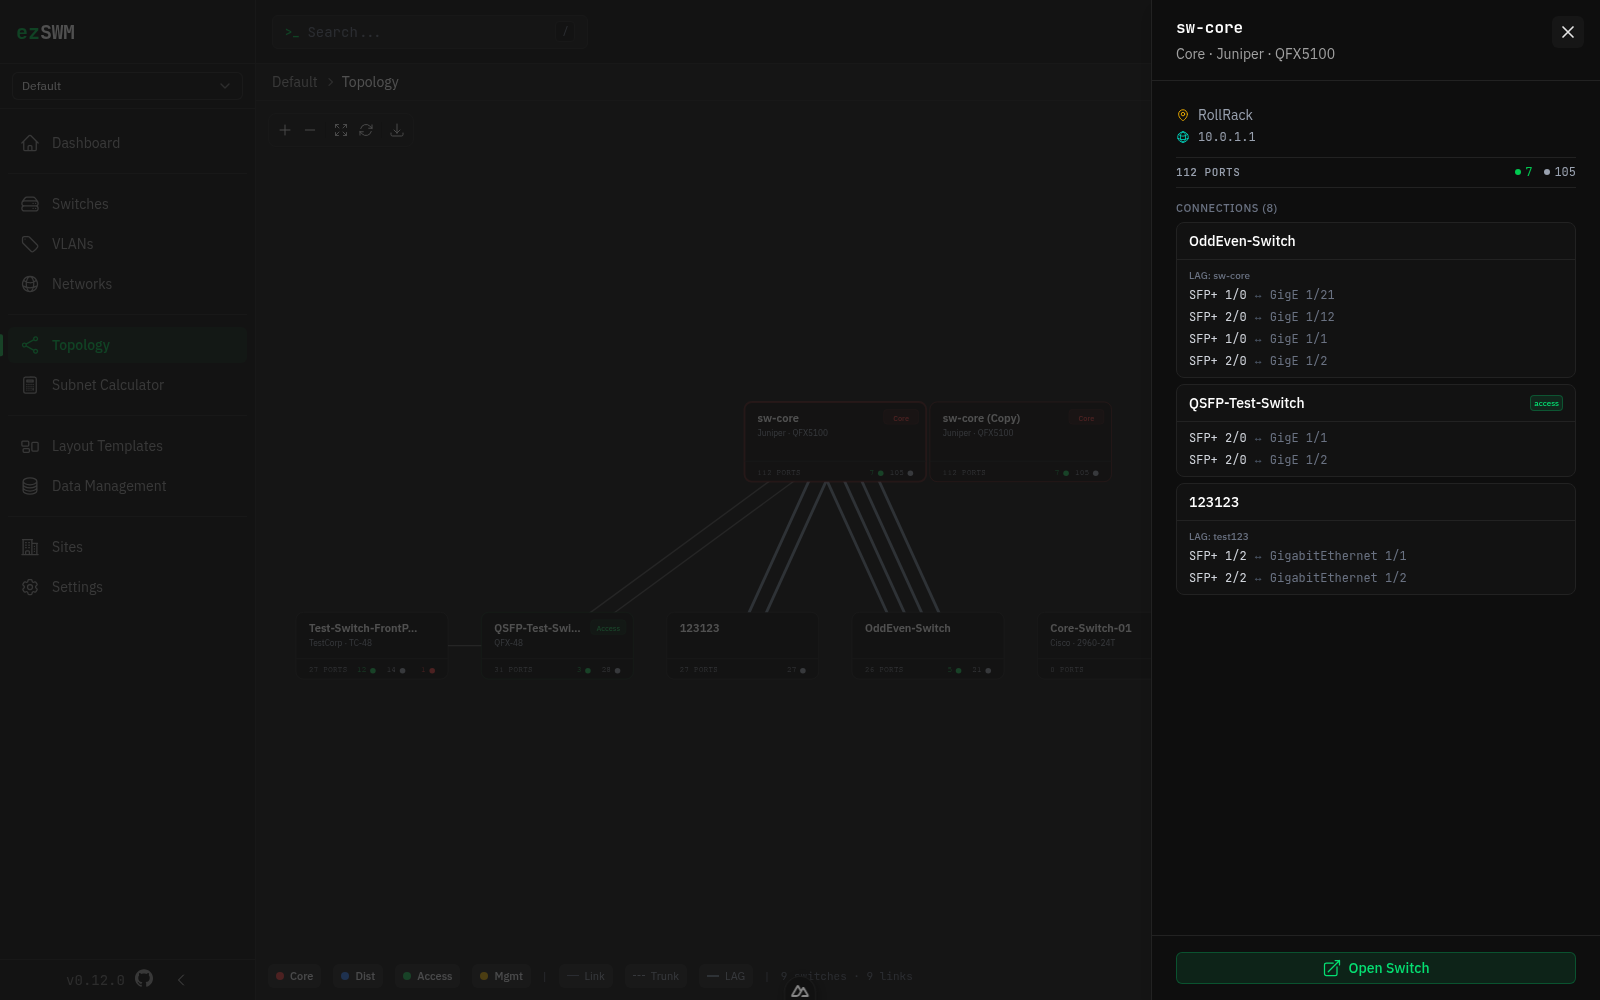
Click Open Switch at the bottom of the panel to navigate to the full switch detail page.
Toolbar
The floating toolbar in the top-left corner provides:
- +/− Zoom in/out
- Fit Reset view to fit all nodes
- Reset Clear saved positions and recalculate layout
- Export Download the current view as a PNG image
Saved Positions
When you drag a node to a new position, all node positions are saved automatically. On the next page load, the layout is restored. Use the Reset button to clear saved positions and return to the automatic hierarchical layout.
VLANs
Creating VLANs
Navigate to VLANs in the sidebar and click Create.
Fields:
- VLAN ID (required) -- integer from 1 to 4094
- Name (required) -- descriptive name, e.g., "Guest WiFi"
- Description -- optional
- Status -- Active or Inactive
- Routing Device -- which router/L3 switch handles this VLAN
- Color (required) -- hex color code; a unique color is auto-suggested to avoid duplicates
Color System
Each VLAN has a unique color that appears on port visualizations across all switches. This makes it easy to visually identify which VLAN a port belongs to. The color picker includes both a visual selector and a hex input field.
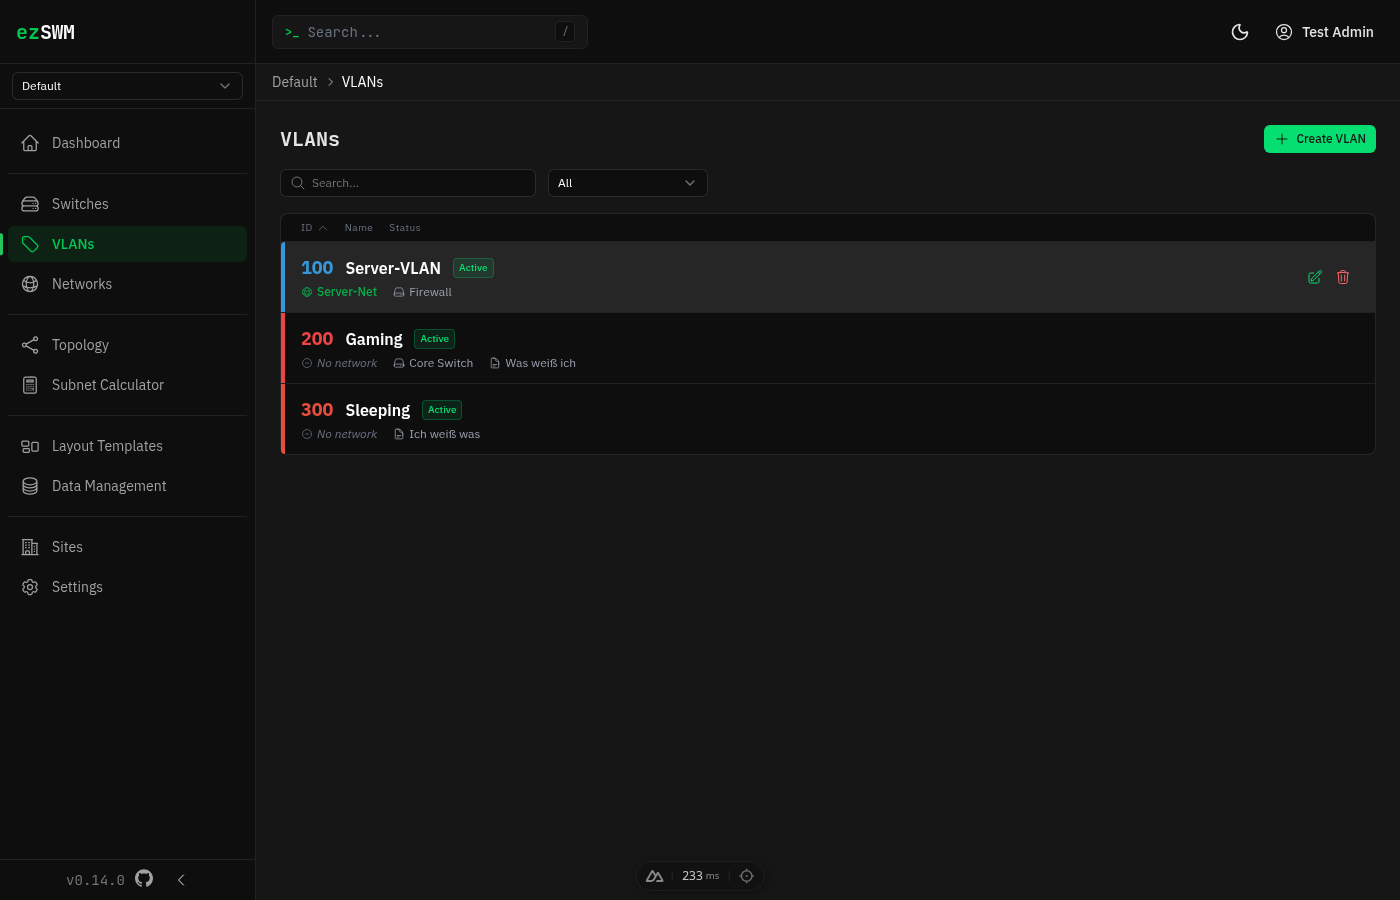
VLAN Detail Sidepanel
Click any VLAN in the list to open a detail sidepanel on the right. The selected VLAN is highlighted in the list, creating a clear master-detail relationship. The sidepanel shows:
- Status and color badges
- Routing device
- Description
- Associated subnets with links
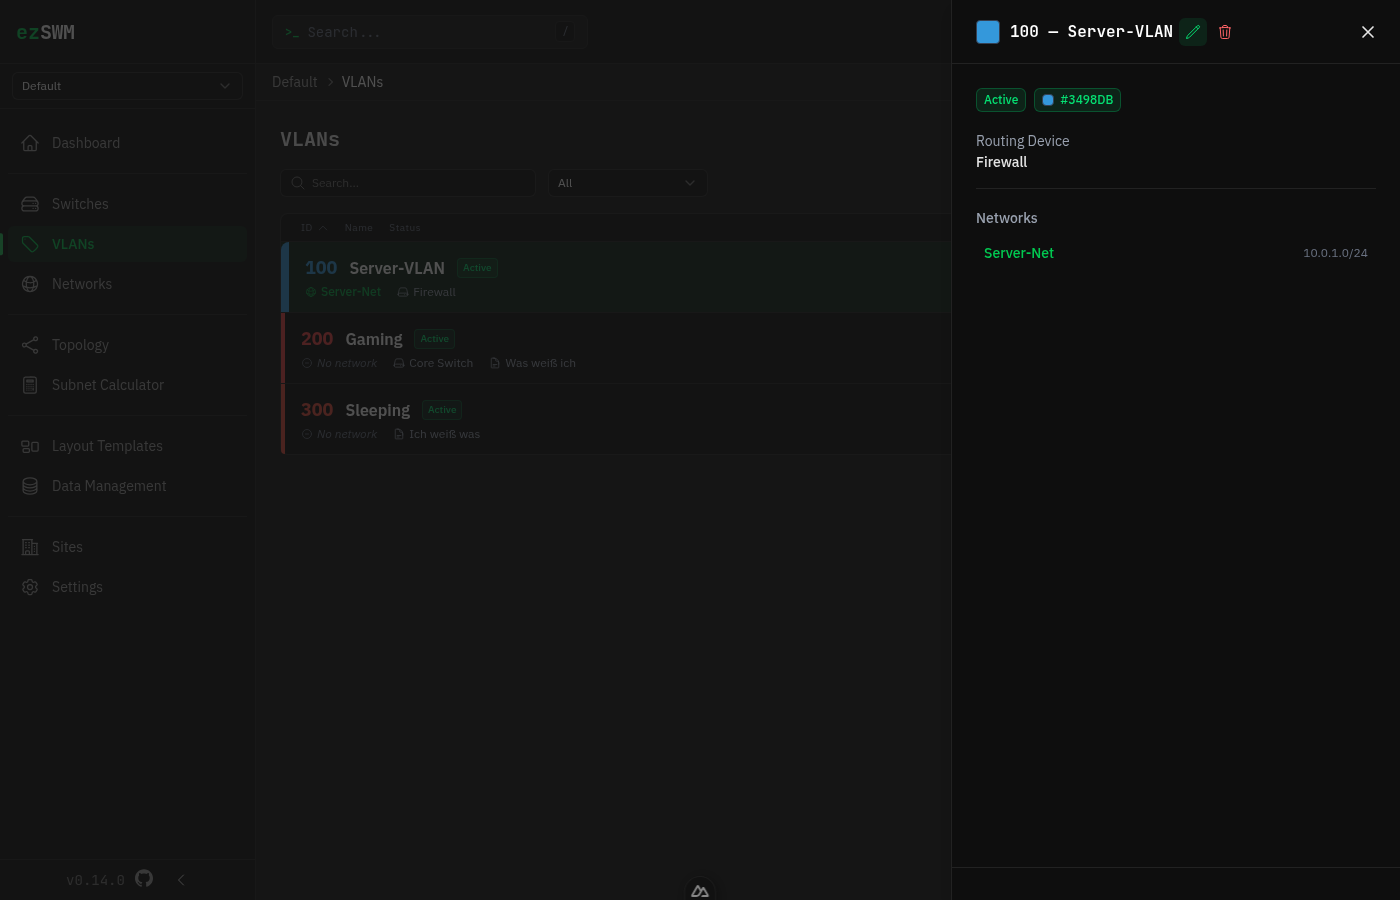
Editing and Deleting
In the sidepanel, click the edit icon to switch to edit mode inline. Click the trash icon to delete the VLAN. You can also access a full detail page for each VLAN with additional information.
Subnets & IP Management
Creating Subnets
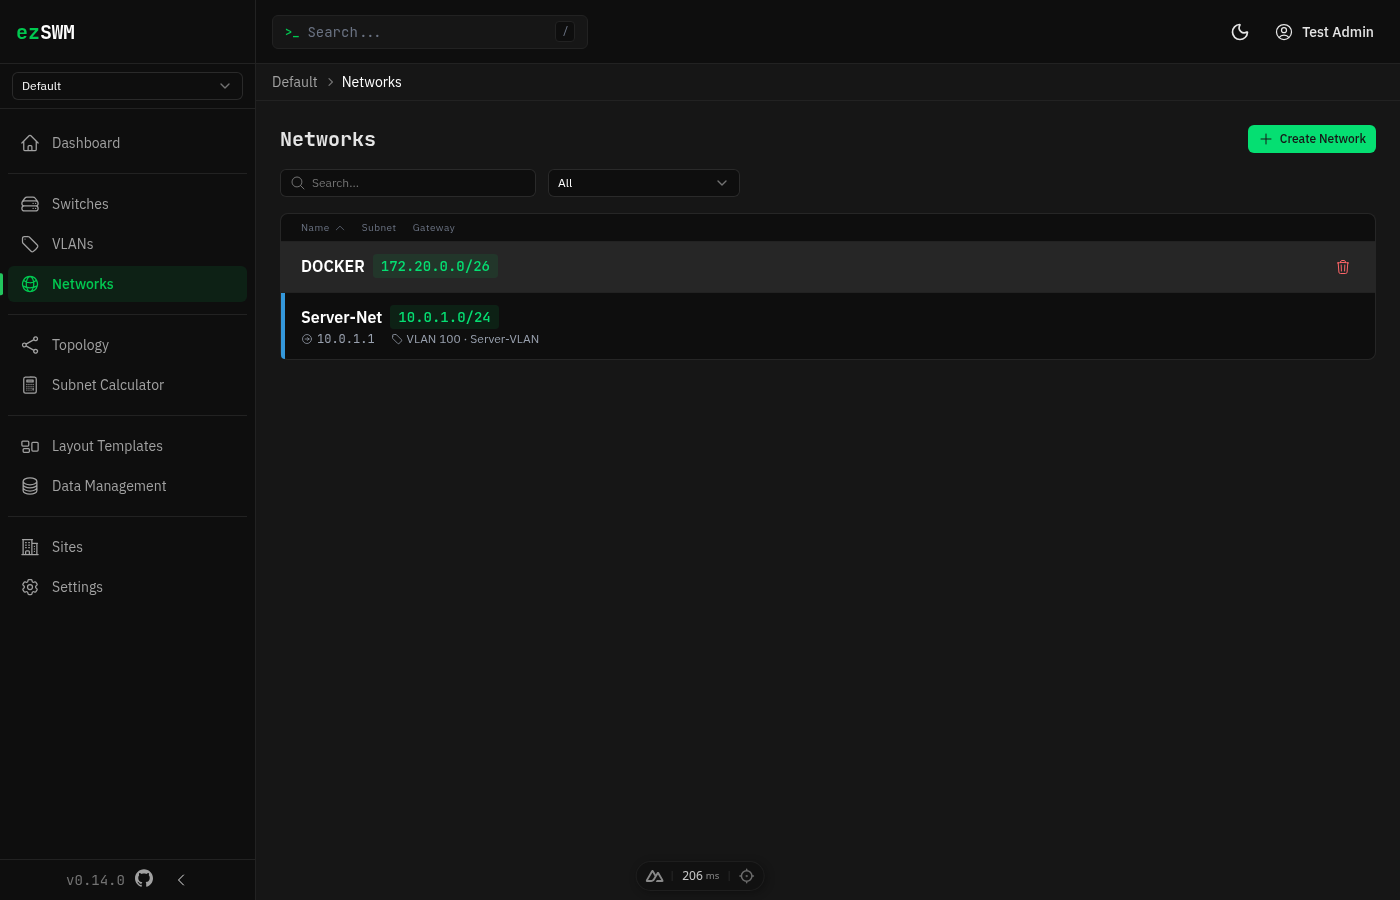
Navigate to Subnets in the sidebar and click Create. The subnet list supports sorting by name, subnet (numerically correct), and gateway. Search, filter, and sort state is preserved in the URL and across sessions via localStorage.
Click-to-copy: On the subnet detail page, click any IP address, subnet, gateway, or mask value to copy it to your clipboard. A confirmation toast appears in the bottom-right corner. This works on all detail pages (subnets, switches, subnet calculator, topology panel).
Fields:
- Name (required) -- e.g., "Server LAN"
- Subnet (required) -- CIDR notation, e.g.,
10.0.1.0/24 - Gateway -- e.g.,
10.0.1.1 - DNS Servers -- comma-separated list, e.g.,
8.8.8.8, 8.8.4.4 - VLAN -- associate this subnet with a VLAN from the dropdown
- Description -- optional
Subnet Detail & IP Overview
The subnet detail page shows subnet statistics (subnet, gateway, mask, hosts, allocated count, associated VLAN) in a compact info bar at the top. Click the info bar to expand additional details (network address, broadcast, DNS servers, description) -- the same pattern used on the switch detail page. A utilization bar below visualizes allocated, DHCP, reserved, and free address space. To edit the subnet, click the pencil icon in the top-right corner -- this opens a slideover panel.
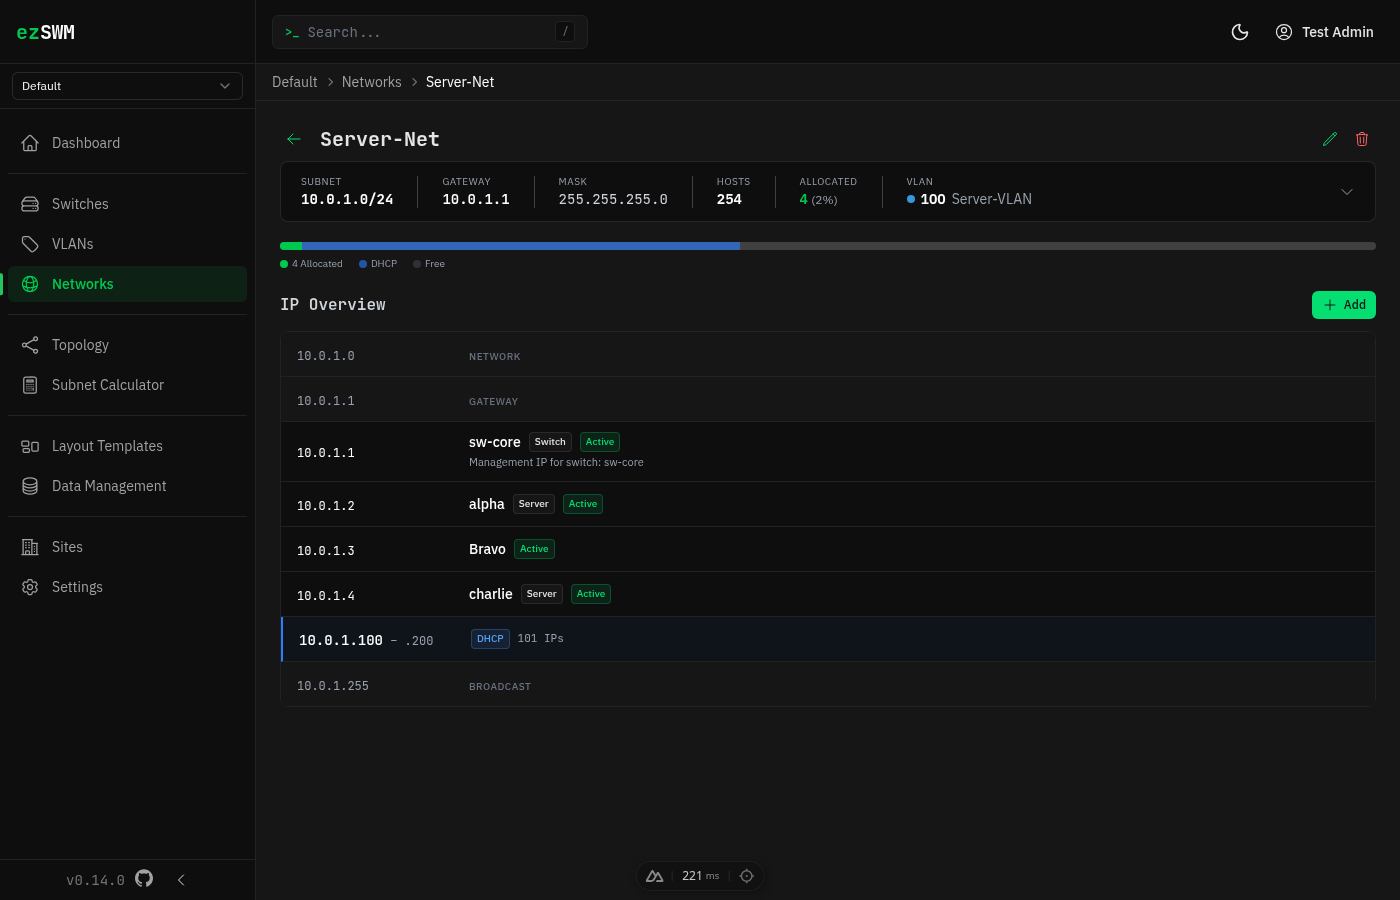
Below the info bar, the IP Overview displays all entries in a unified, sorted list:
- Fixed rows (network address, gateway, broadcast) -- shown in a muted style
- IP Allocations -- individual host entries with hostname, device type badge, status badge, and optional MAC address / description
- IP Ranges -- DHCP, static, or reserved blocks with color-coded left border and IP count
Clicking any allocation or range row opens the corresponding edit sidepanel. The selected row is highlighted to show the master-detail relationship. Hover actions (edit/delete buttons) appear on the right side of each row.
IP Allocations
Click Add to open the add/edit sidepanel. Each allocation records:
- IP Address (required)
- Hostname -- displayed as the primary identifier in the IP overview
- Device Type -- Server, Switch, Router, Firewall, Printer, Phone, AP, Camera, or Other (shown as a badge)
- Status -- Active, Reserved, or Inactive
- MAC Address -- shown as secondary info in the row
- Description -- shown as secondary info in the row
IP Ranges
IP ranges designate blocks of addresses for specific purposes:
- DHCP -- addresses handed out dynamically (blue indicator)
- Static -- addresses assigned manually (green indicator)
- Reserved -- addresses set aside for infrastructure (yellow indicator)
Each range has a start IP, end IP, type, and optional description. The IP count is shown inline.
Special Subnets (/31 and /32)
ezSWM handles IPv4 special subnets according to their RFCs:
- /31 (Point-to-Point, RFC 3021) -- Both addresses are usable endpoints. The detail page shows "Endpoint A" and "Endpoint B" instead of "Network" and "Broadcast", with a "Point-to-Point" badge. DHCP ranges cannot be created for /31 networks.
- /32 (Host Route) -- Single host address. The detail page shows "Host Address" with a "Host Route" badge. No broadcast row is displayed. DHCP ranges cannot be created for /32 networks.
The Subnet Calculator applies the same labels and badges.
Utilization Tracking
The utilization bar at the top of the subnet detail page visualizes address space usage. The legend shows allocated, DHCP, reserved, and free counts.
IP Addresses (site-wide)
The IP Addresses page in the sidebar gives you a flat, table-style view of every IP allocation across all subnets of the current site (or across every site in "All Sites" mode). Useful when you want to scan, filter, or look up an IP without first navigating into a specific subnet.
Columns: IP · Hostname · MAC · Subnet (name + CIDR) · VLAN (colored badge) · Device Type · Status. In "All Sites" mode an additional Site column is shown.
Filters & sort: a search box matches IP / hostname / MAC. Separate dropdowns filter by VLAN, Status, and Device Type. Filter state is preserved in the URL and across sessions via localStorage. Click the IP column header to sort numerically (so .10 comes after .9, not after .1). The table body scrolls internally — the page header, filters, and column headers stay fixed while you scroll, on desktop and mobile.
Row click → edit: clicking any row opens an edit slideover. Delete lives in the slideover header, so no per-row action buttons clutter the table.
Moving an IP to another subnet: edit the IP address and save. If the new address belongs to another subnet in the same site, ezSWM asks you to confirm the move and shows the old/new IP, subnet, and VLAN before saving. If more than one subnet matches, pick the target subnet explicitly.
Adding an IP: click Add IP Address. As soon as you type a valid IP, the Subnet dropdown auto-selects the subnet whose CIDR contains it — no need to pick the subnet manually. You can always override the dropdown (useful in "All Sites" mode where ranges from different sites can overlap). The VLAN of the chosen subnet is shown read-only next to it.
DHCP-range protection: if the IP you try to create — or to move to via editing — falls inside a DHCP range, the form rejects it with a clear message: IP x.x.x.x is inside a DHCP dynamic range (start – end). Static IPs cannot be assigned within dynamic DHCP ranges. This applies symmetrically on create and on edit, so you can't accidentally move a static allocation into a DHCP scope by editing its IP.
Global Search
Press / or click the search bar in the header to open global search. It searches across:
- Switches (by name, location, management IP, model, manufacturer, tags)
- VLANs (by name, VLAN ID)
- Subnets (by name, CIDR)
- IP allocations (by IP, hostname)
- IP ranges (by start/end IP, type, subnet name)
- Layout templates (by name)
- LAG groups (by name, description, remote device)
Use arrow keys to navigate results and Enter to jump to the selected item. LAG search results deep-link to the switch detail page with the LAG edit slideover open.
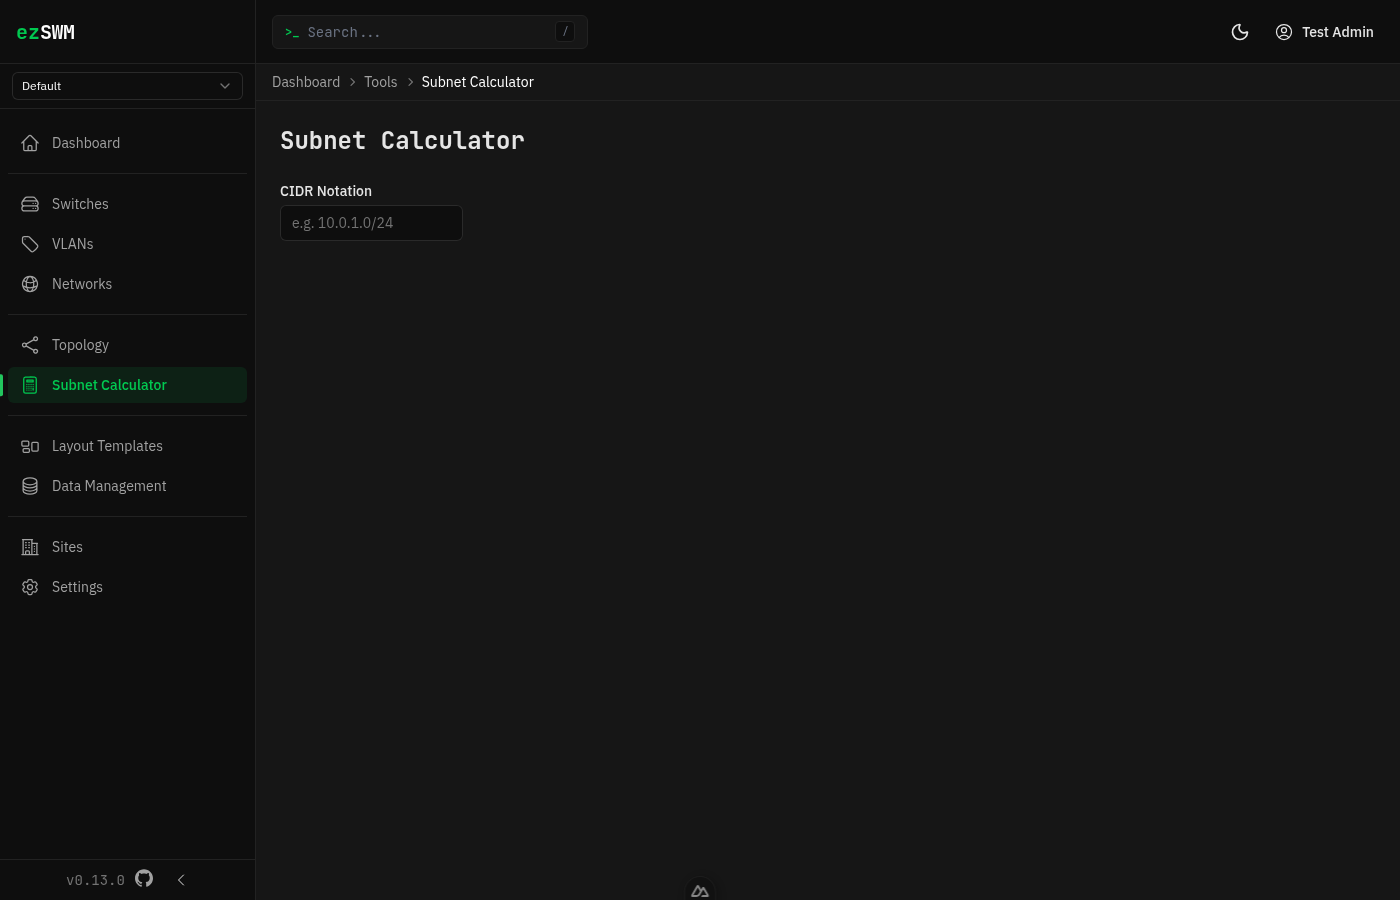
Subnet Calculator
Navigate to Subnet Calculator in the sidebar. Enter any IPv4 address with a CIDR prefix (e.g., 192.168.1.0/24) and the calculator shows:
- Network address and broadcast address
- Usable host range (first and last host)
- Total number of addresses and usable hosts
- Subnet mask in dotted decimal and binary notation
- Wildcard mask
- CIDR notation
- IP class
This is a client-side tool — no data is saved. Useful for quick subnet calculations during network planning.
Data Management
Export
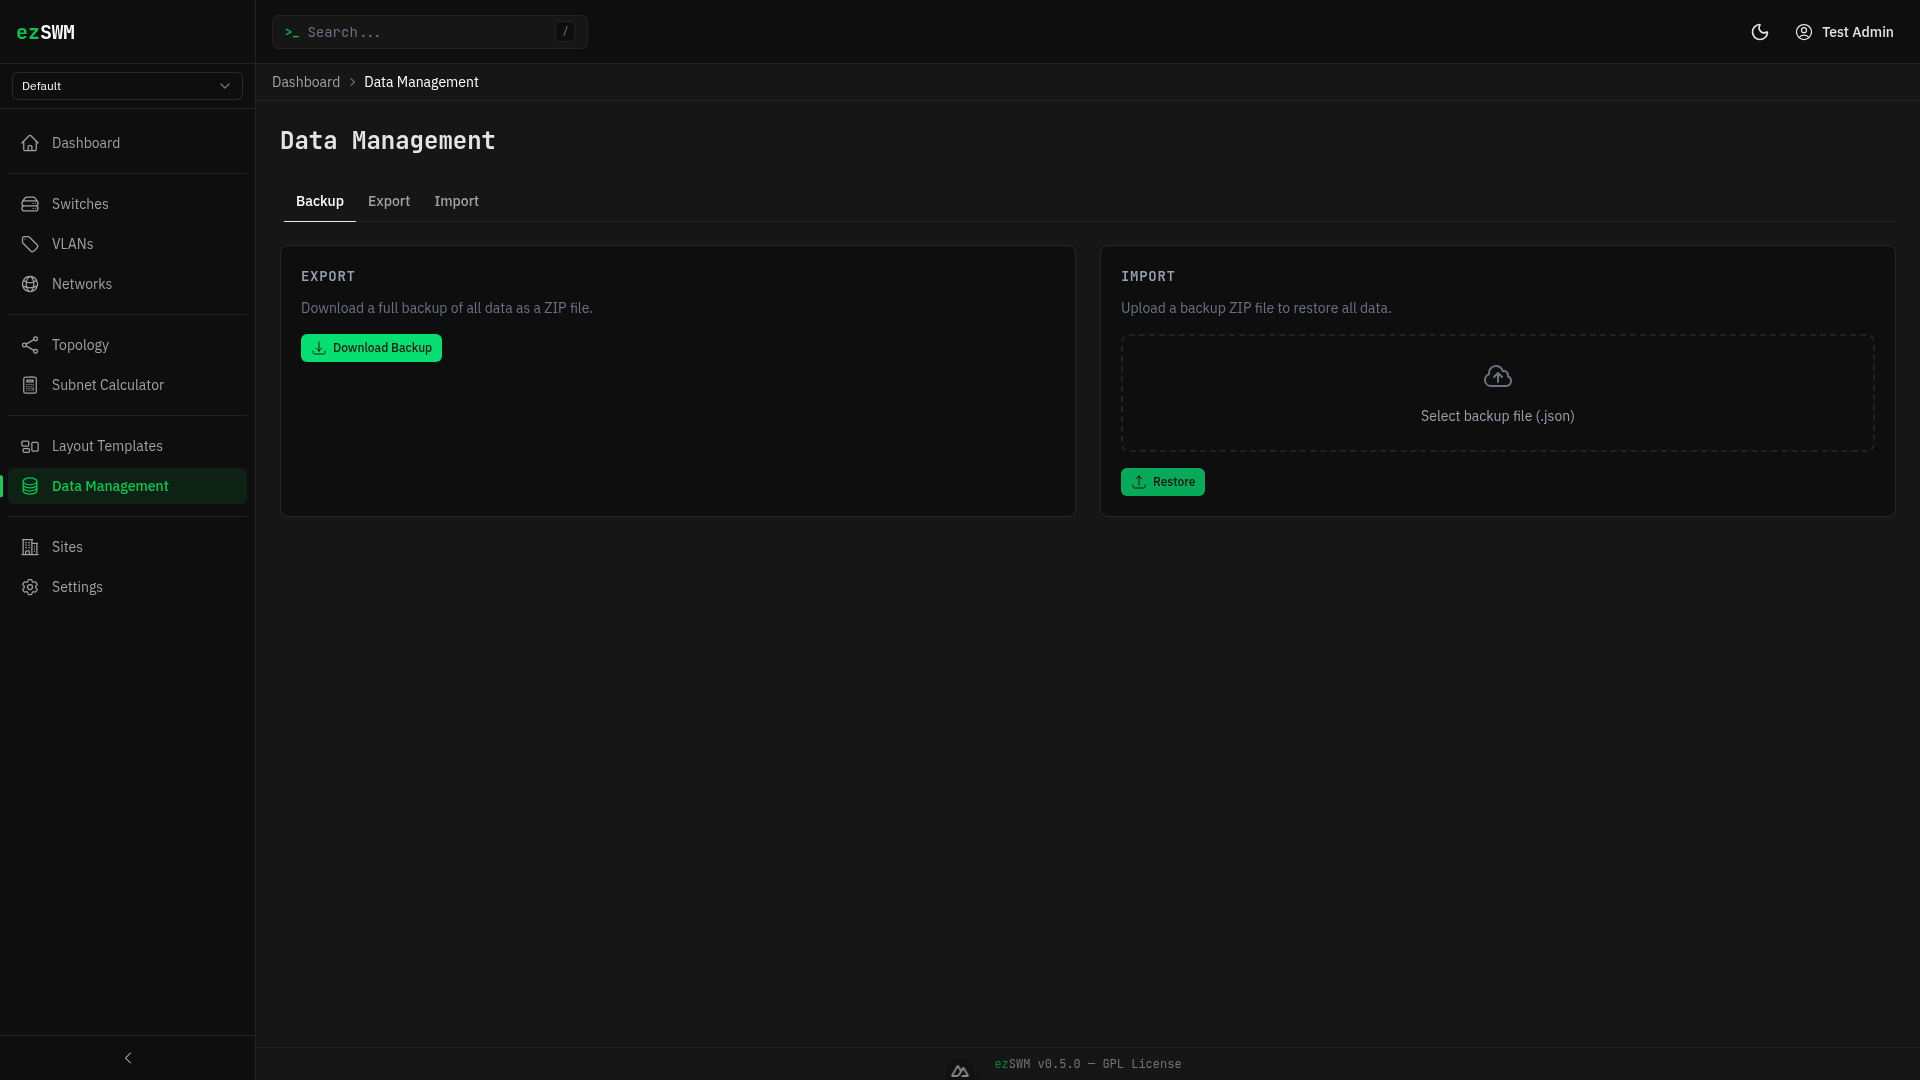
Each entity type (switches, VLANs, subnets, IP allocations, IP ranges, layout templates) can be individually exported to JSON or CSV. The Backup & Restore tab also produces a single JSON file containing every table, tagged with schema: "sqlite-v1".
Import and Restore (temporarily disabled in 0.21.x)
Import & Restore are being reworked for SQLite
The 0.21 storage switch left the write side of the import/restore flow on the legacy JSON path, which doesn't translate cleanly to the new schema with FK constraints. The import endpoints and the activity-log undo button currently return 501 Not Implemented:
- Per-entity import (drag a CSV/JSON onto a list)
- Full backup restore (Backup & Restore tab)
- Activity-log "Undo" button
They'll be back in a follow-up release. Until then, the Export side still works, and you can roll back manually by copying a previous db.sqlite file into place. Track progress in #156.
Backup Format
Backups are JSON dumps of the underlying SQLite tables, one array per entity, with a schema: "sqlite-v1" marker at the top. JSON-column fields (tags, configured_vlans, port tagged_vlans, layout units, activity changes/previous_state) are kept as JSON strings — the restore path parses them back on the way in.
Settings
General Settings
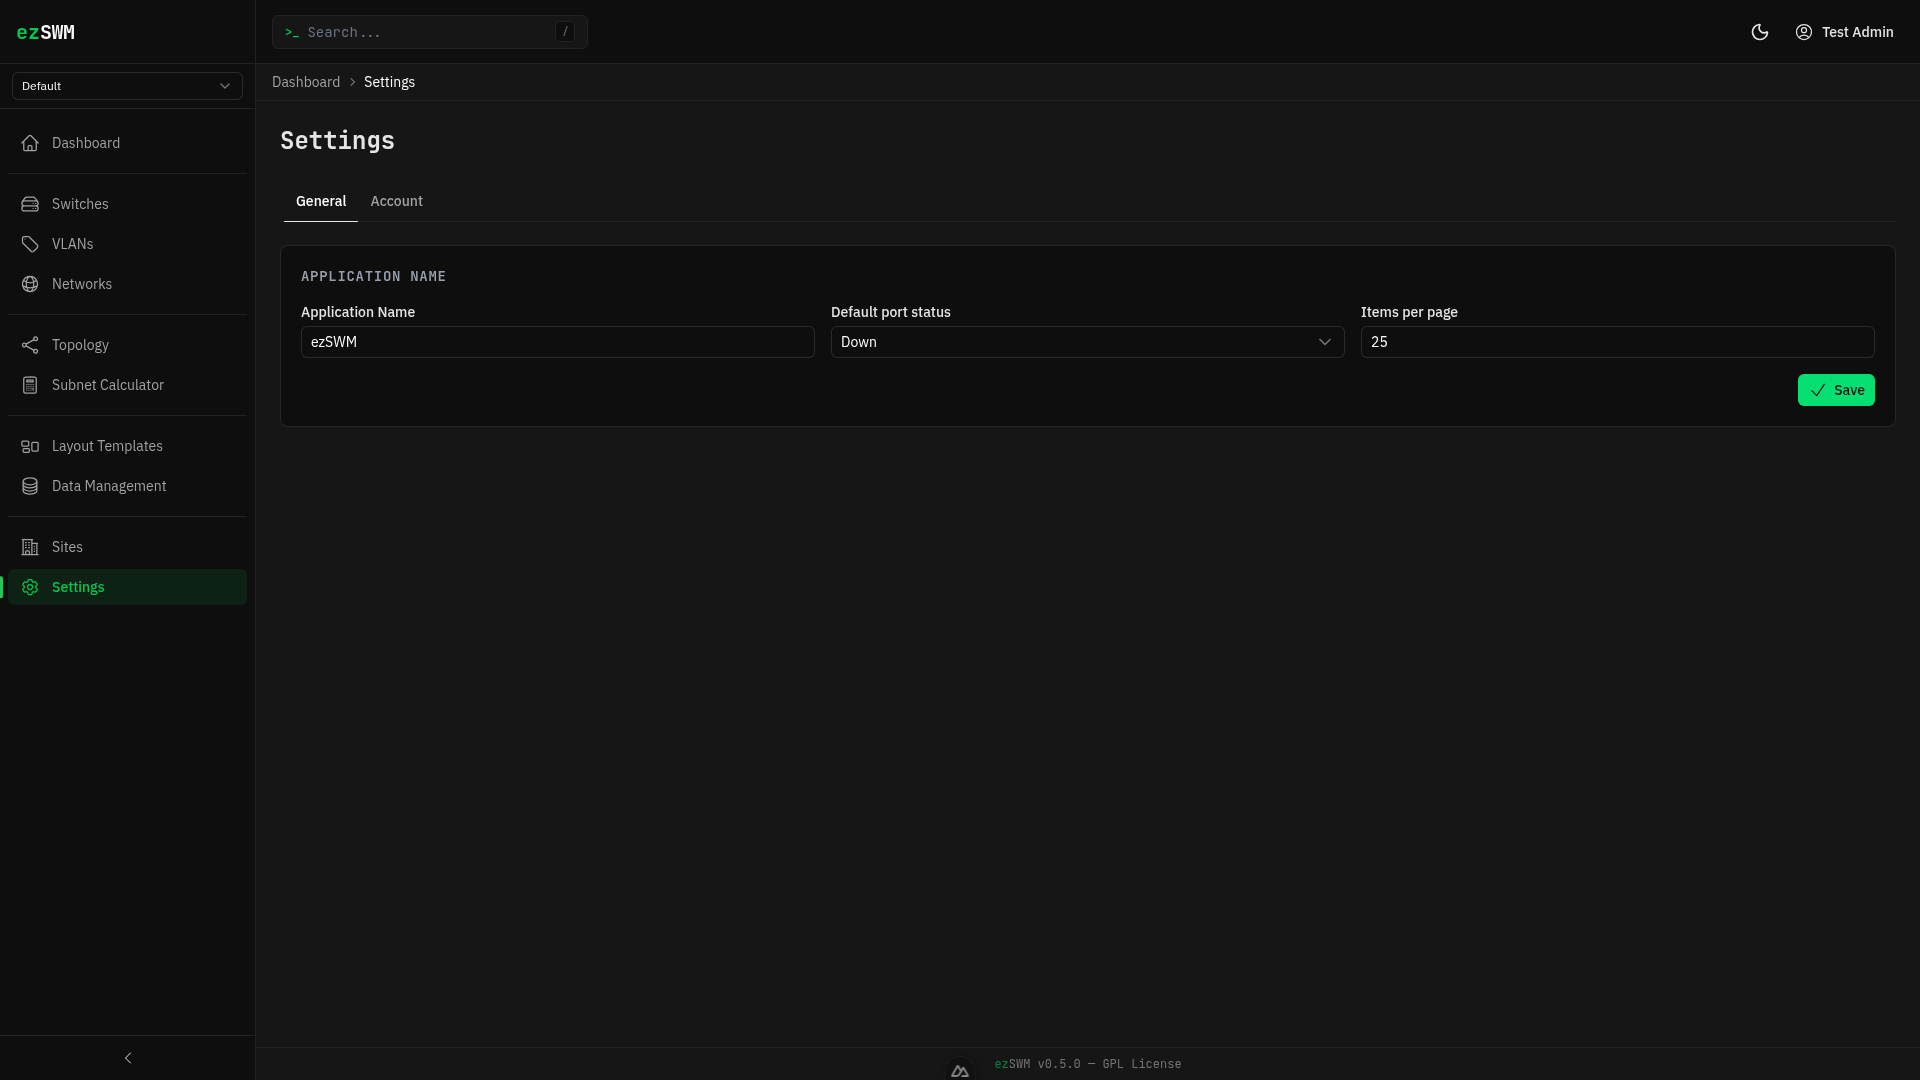
Access settings via the user menu in the header or the sidebar. General settings cover application-level configuration.
Account Settings
Change your display name and preferred language (English or German).
Password Change
Change your password from the account settings page. You must provide your current password and confirm the new one.
Sites
What They Are
Sites represent physical locations or logical groupings for your infrastructure. Each site has its own switches, VLANs, subnets, and topology. Use sites to separate different locations (e.g., "Data Center", "Office", "LAN Party Hall A").
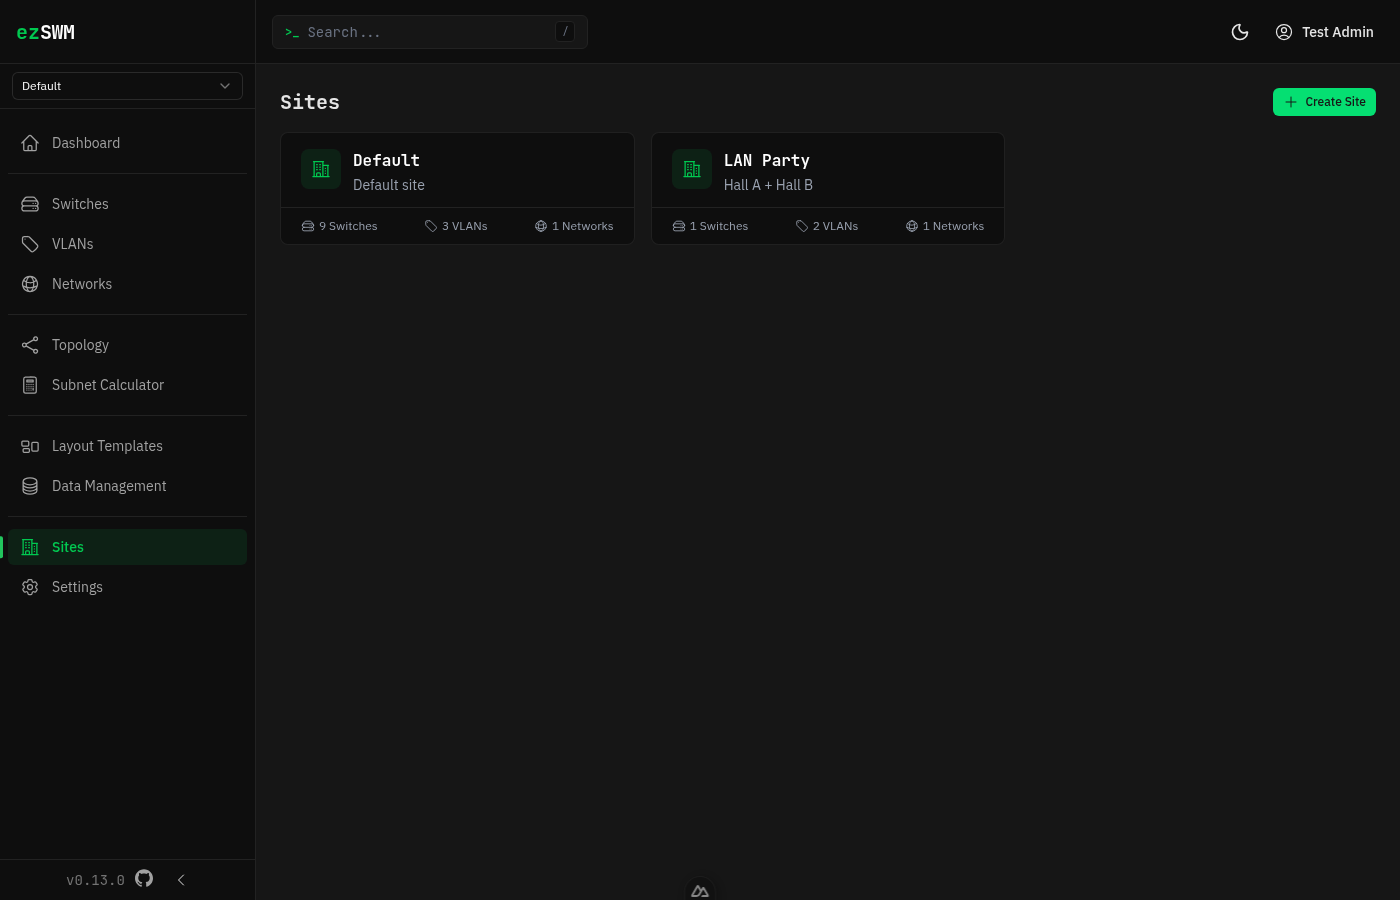
Managing Sites
Navigate to Sites in the sidebar to see all sites. Click Create Site to add a new one. Each site has a name and optional description.
Deleting a site also deletes its scoped switches, VLANs, subnets, IP allocations, IP ranges, topology layout, and related activity log entries. Global data such as users and layout templates is kept.
When you select a site from the dropdown in the sidebar, all views (switches, VLANs, subnets, topology) are scoped to that site. Select "All Sites" to see everything across all locations.
First Site
The first site is created during the setup wizard and you choose its name yourself. You can rename it later or create additional sites at any time.
Architecture Overview
The following diagram shows how requests flow through ezSWM:
Upgrading to 0.21.x
Storage moved from flat JSON files to embedded SQLite in 0.21.0. The first boot of the new image detects your existing data/*.json next to an empty database, runs a one-shot migration in a single transaction (every record gets a fresh UUIDv4, all cross-references are remapped), and moves the original JSON files into data/_archive_<ISO>/ for safekeeping. URLs change because IDs are regenerated — bookmarks on specific entities break once, the UI itself is unchanged. See the installation guide for the exact sequence and the failure mode.